Click on the spss icon.

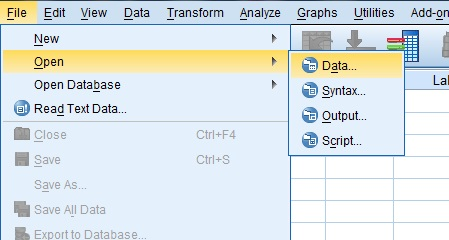
Click on file. Then click on data.
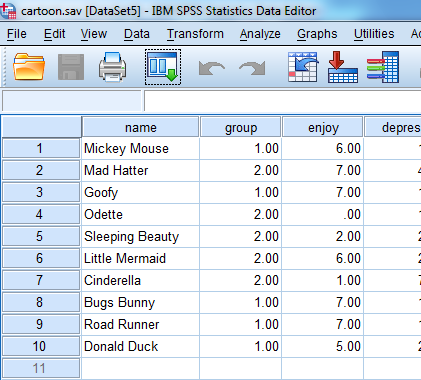
Selcec the cartoon.sav file.
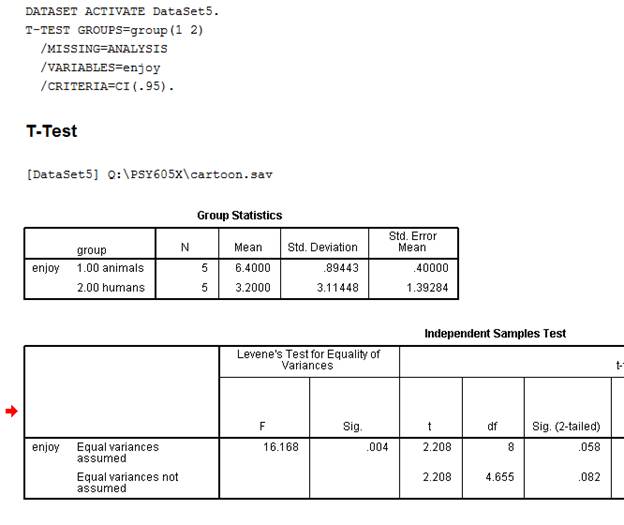
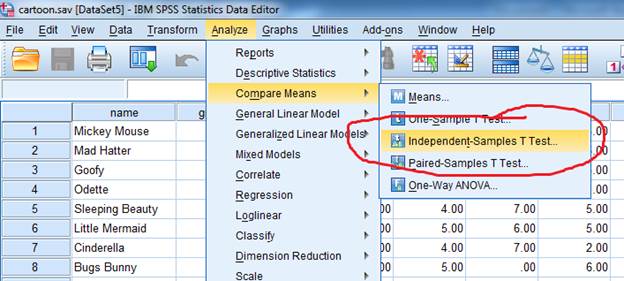
Click on Analyze > Compare Means > Independent-Samples T-test.
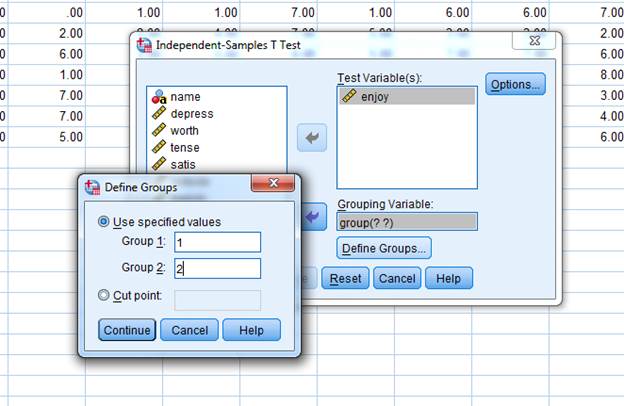
Select enjoy from the variable list.
Put Group in the Grouping window.
Click on Define Groups. Put 1 in one window and 2 in the other.
Click Continue.
Then click paste.
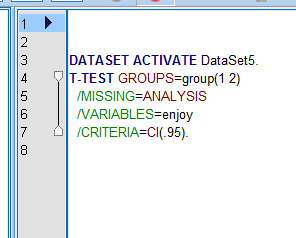
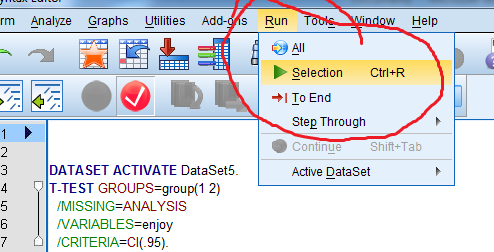
Select all of the lines in the Syntax window then click selection.