Quick guide for analyzing the multitrait multimethod structural equation modeling approach to construct validity.
Merle Canfield
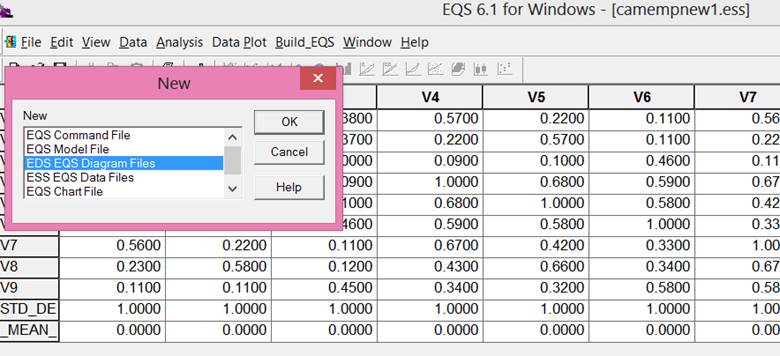
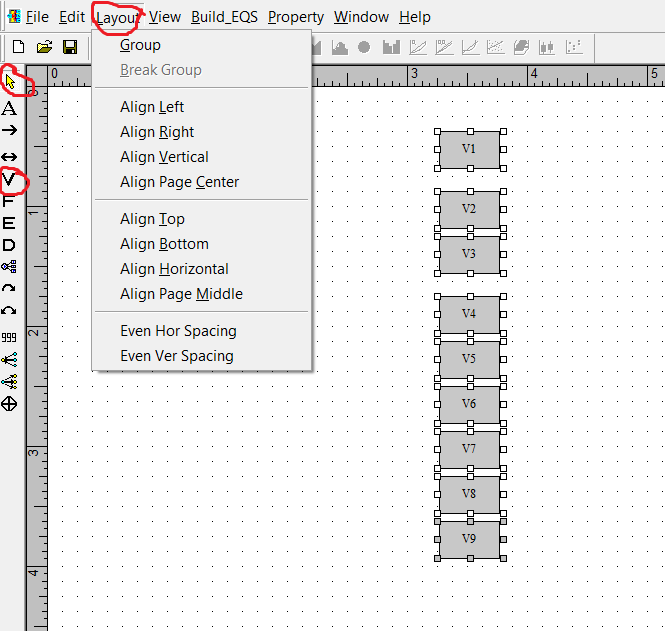
First make the column of variables by clicking on the V (circled in red). Then start at the top and click once for each variable. You can’t quite get them aligned exactly – just try to get close. Then use the yellow arrow to select all of the variables. Then click Layout (circled in red) and click on Align Left and then Even Ver Spacing.
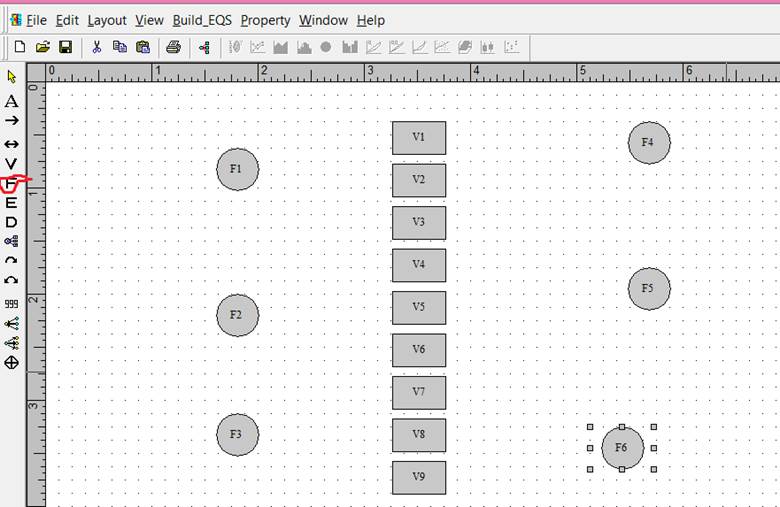
The factors were generated by clicking on the F (circled in red). Each column of factors is given the same treatment with Layout as was given to variables to align them.
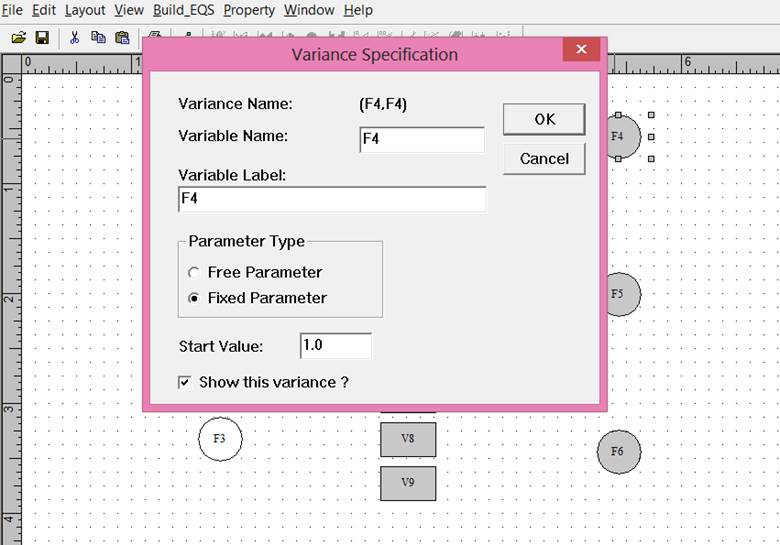
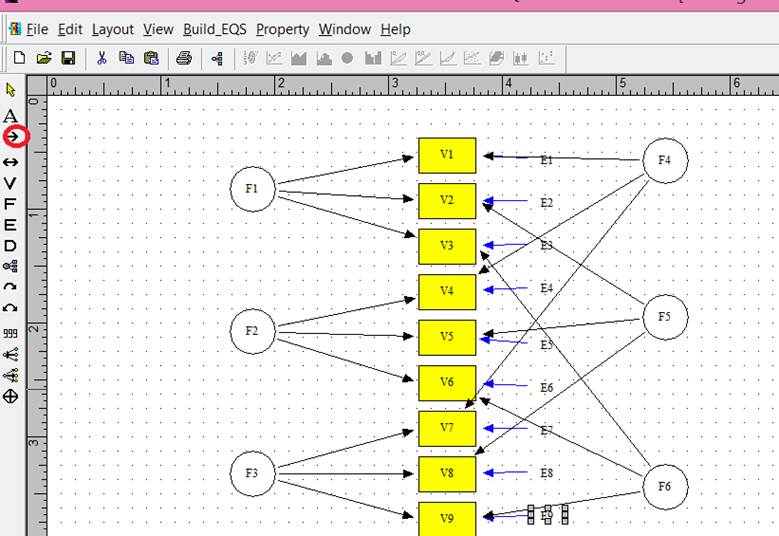
The parameters from the factors to the variables are generated by clicking on the straight arrow (circled in red) and then clicking within the factor and then the desired variable.
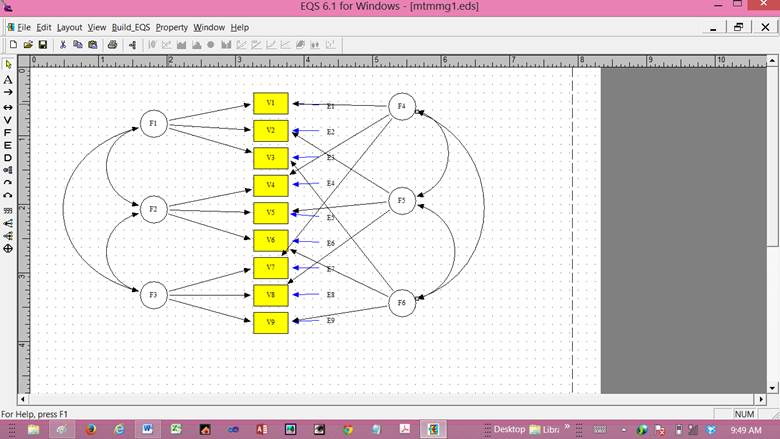
Model 1. Full model.
Four models are required.
The procedure described by Byrne (2010)
involves four different analyses. The analyses are: (1) the full model as
presented in Figure 1; (2) methods only (all trait factors and corresponding
parameters were removed and the method factors allowed to correlate) (model 2); (3) all of the
correlations among the trait factors were set to 1.00 and the method factors
allowed to correlate (model 3); and (4) the correlation between the method
factors was eliminated and the trait factors allowed to correlate (model 4).
The results from these four analyses are in Table 2.
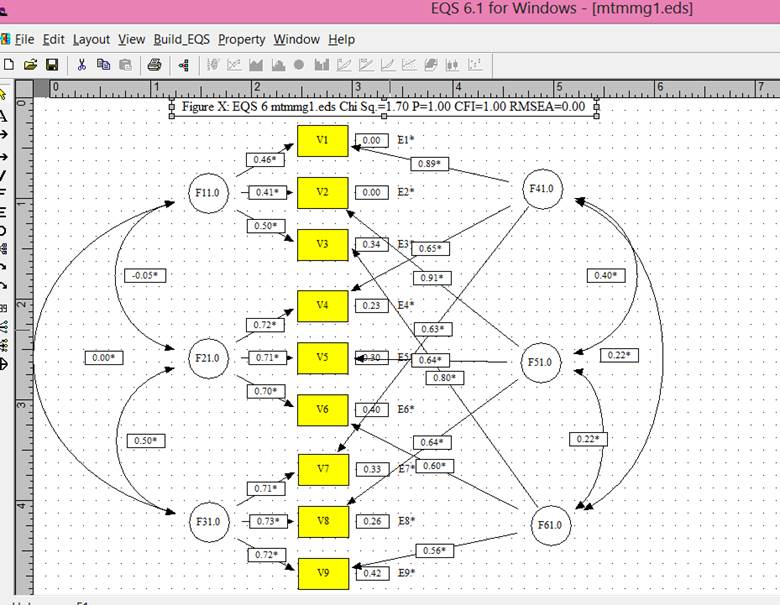
Model 1. Full model.
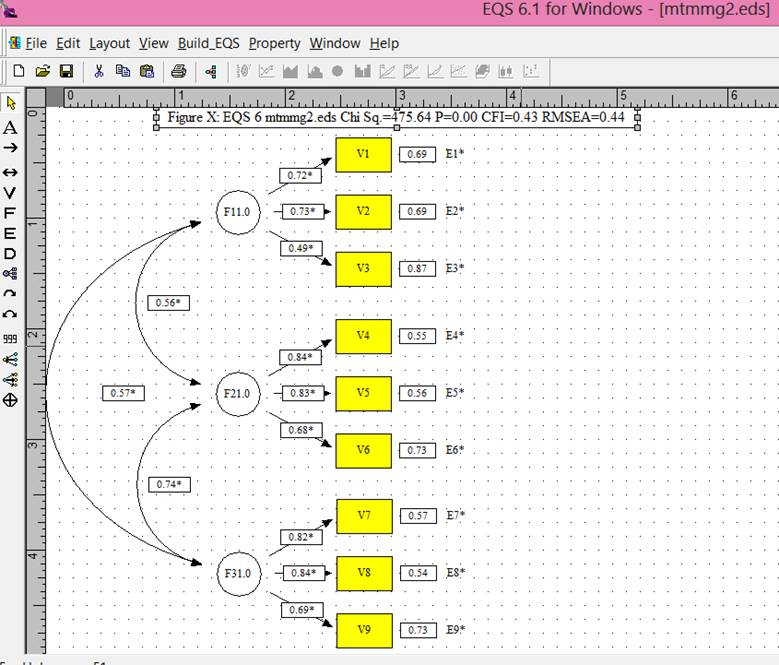
Model 2. Traits eliminated.
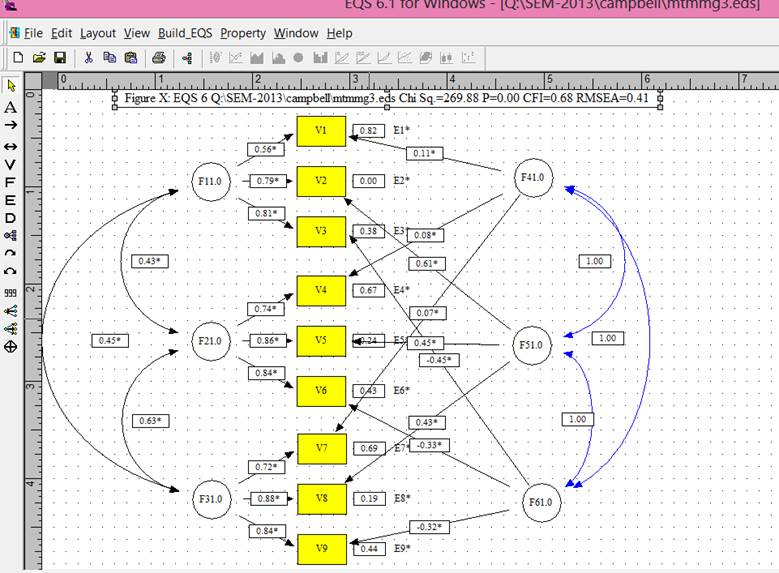
Model 3. Trait factor correlations contrained to 1.0.
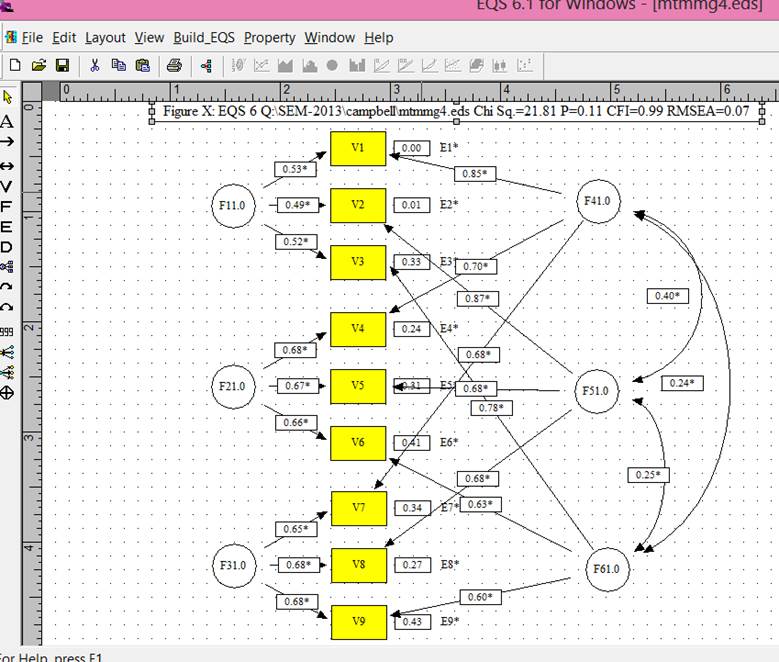
Model 4. Method factors not allowed to
correlate.
Table 2. The c2, degrees of freedom, and comparative fit index
for each of the four disciplinemodels
|
Model 1 |
Model 2 |
Model 3 |
Model 4 |
|
|
c2 |
1.969 |
475.636 |
269.884 |
21.813 |
|
df |
12 |
24 |
15 |
15 |
|
cfi |
1.00 |
0.429 |
0.678 |
0.991 |
Convergent and
discriminant validity are assessed by two different methods: one method uses
the c2,the other
the comparative fit indexes. Both methods included differences among these
indexes in the four models. Table 3 shows the differences among the models and
which kind of validity is assessed by the difference.
19.844
Table 3.
Comparison of goodness-of-fit of the three discipline models
|
c2 |
df |
cfi |
|
|
model 1 vs
model 2 |
473.667** |
12 |
0.571 |
|
model 1 vs
model 3 |
267.915** |
3 |
0.322 |
|
model 1 vs
model 4 |
19.844** |
3 |
0.009 |
** indicates significance at .01 level of probability
The significant
difference between model 1 and model 2 as evidenced by the significant c2
(473.667 with 12 df and
p<.01) and the comparative fit index greater than .01 is indicative of
convergent validity. The significant difference between model 1 and model 3 as
evidenced by the significant c2
(267.915 with 3 df and
p<.01) and the comparative fit index greater than .01 is indicative of
discriminant validity. Also indicative of discriminant validity is the lack of
significant difference between model 1 and model 4 (c2 =
19.844 with 3 df results in
a p<.01).
Convergent
validity is supported by the significant c2 difference between model 1 and model 2
indicated and the CFI change greater than .01. Discriminant validity is
supported by the significant c2 of
473.667 between model 1 and model 3 and the CFI of .571 and is further
supported by the non-significant c2 of 19.844 between model 1 and model 4 and the
CFI of 0.001.