This section deals with
the variations of the correlation coefficient and nonparametric statistical
procedures. Comparisons will be made between various parametric and
nonparametric statistics. The correlation is a parametric statistic but
is used here as a starting point or comparison for nonparametric statistics.
Nonparametric Statistics
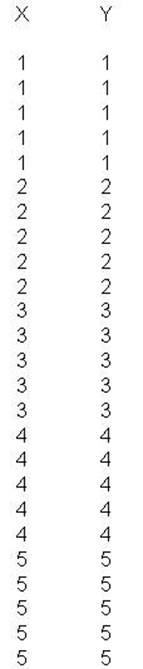
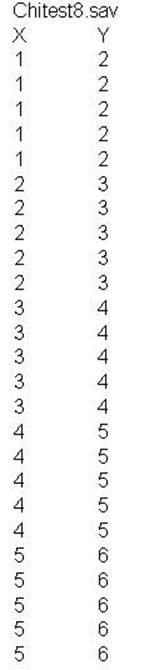
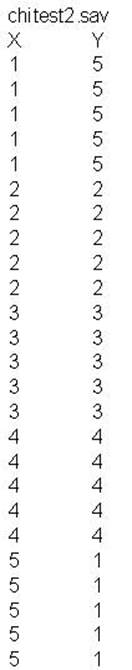
The first set data to be
used for the examples that follows:
Chitest1.sav
The following clicks
will produce the resulting Syntax File
Click on Analyze
Click on Correlate
Click on Bivariate
Select both X and Y Variables
Click on right delta button
Click on Options
Select Means and Standard Deviations
Click Continue
Click Paste
Type in "Get file = 'e:/dape/chitest1.sav'."
Click Run
Click All
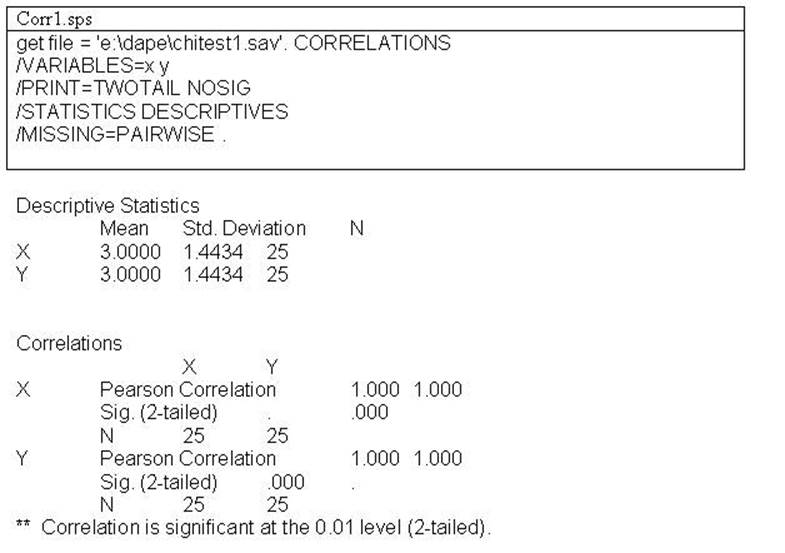
The above clicks will
produce the following syntax file and output
Two types of Nonparmetric Procedures (Correlational & Test group
differences)
A. Nonparametric
Correlation Procedures
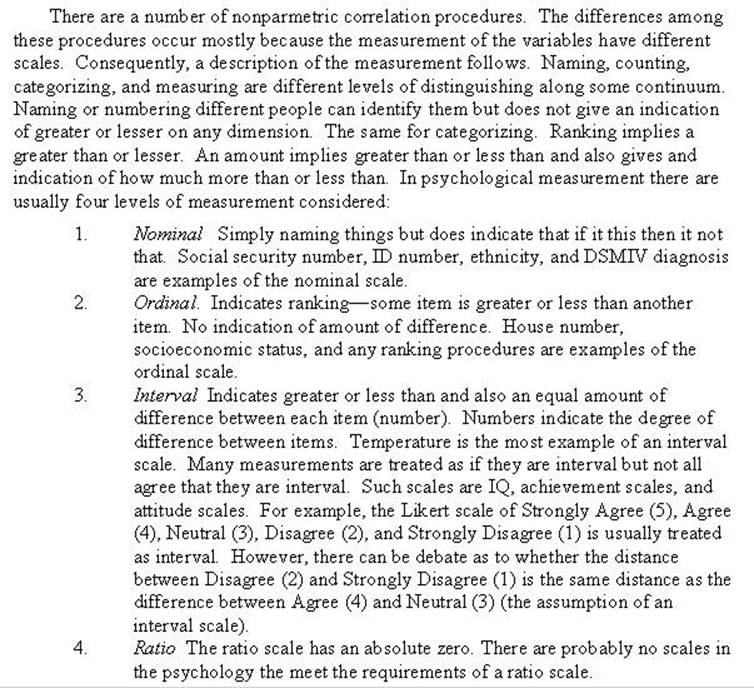
Nonparametric procedures allows one to correlate variables when their scales
are nominal and ordinal. Consequently, nonparametric procedures are used when
the scale of measurement of the data are only at the
level of nominal or ordinal. The output from the various
programs indicate level of measurement. The next set of clicks produces
and number [ Correlation Nonparametric ]
(assumes file
"chitest1.sav" is open ).
Click Analyze
Click Descriptive Statistics
Click Crosstabs
Select the X variable Click delta button
Select the Y variable Click delta button
Click Statistics
Select all desired statistics by clicking in the
corresponding box
Click Continue
Click Paste
Click Run
Click All
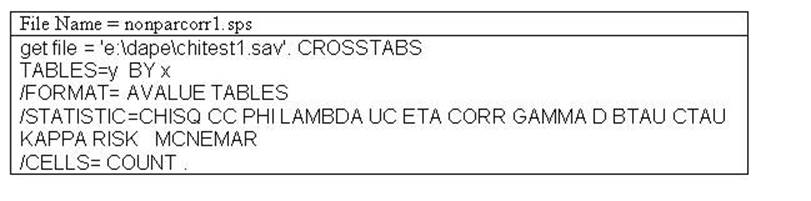
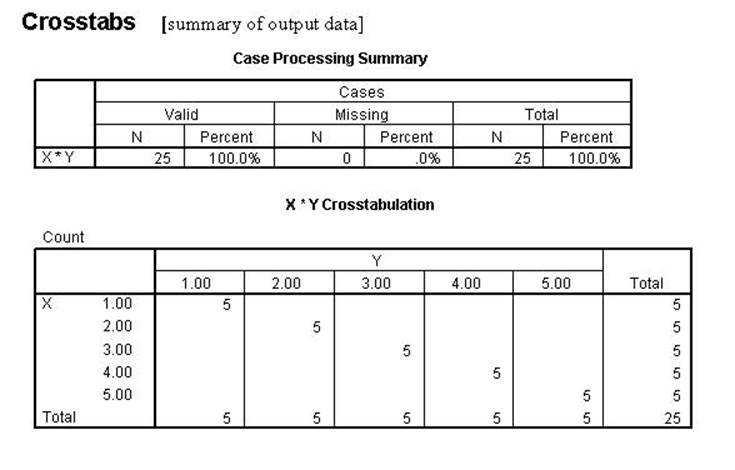
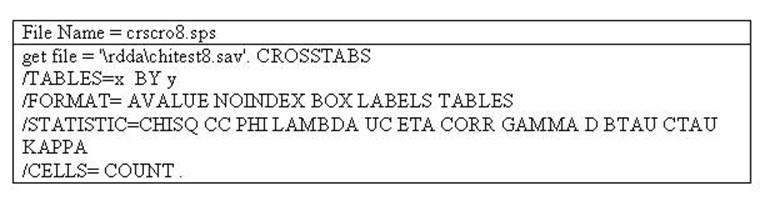
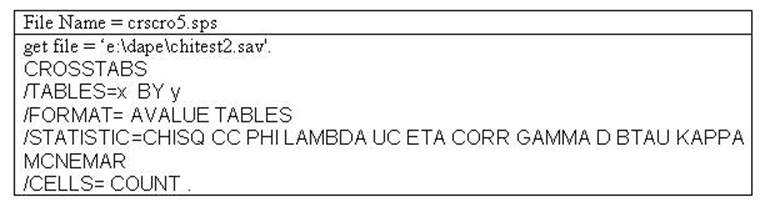
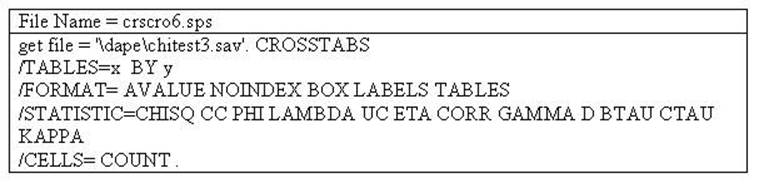
The syntax file (nonparcorr1.sps) program with the data labeled
"chitest1.sav' data produces the following output:
The next analysis shows
the difference between those statistics that show a linear relationship and
those that show a conditional relationship. Those that retain perfect
relationships are conditional while those that are less than perfect show
linear relationships.
The following syntax file and data produces the resulting output.
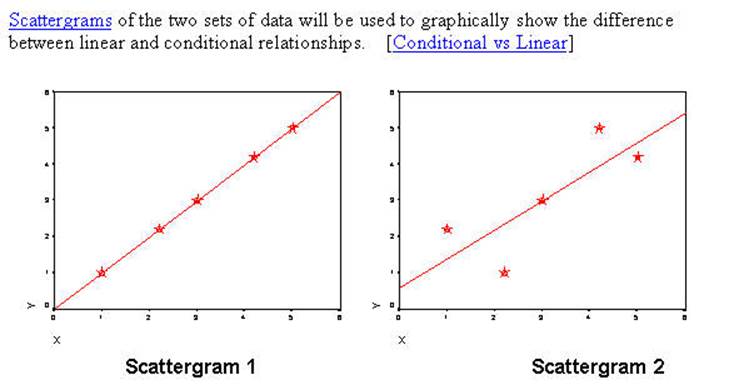
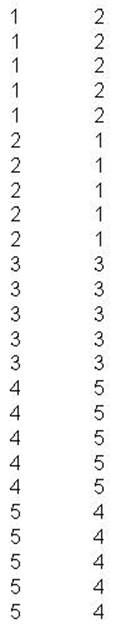
In the two scattergrams above there are five cases for each of the
circle/stars representing the data from the two examples. Scattergram
1 is generated from the data set CHITEST1 and Scattergram
2 is generated from the data set CHITEST2. For this discussion the Pearson
Correlation and the Pearson Chi Square will be the examplars.
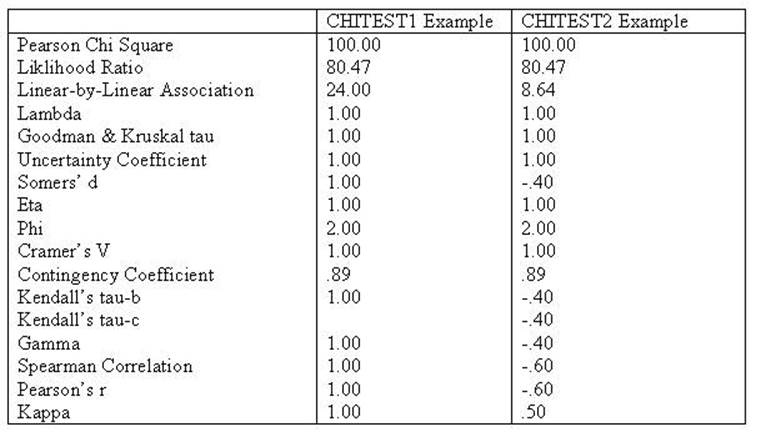
The table below is a summary of other statistics representing linear or
conditional relationships. Those that remain perfect relationships (for the
CHITEST2 data) are conditional relationships while those that become less than
perfect are linear relationships. The difference between the two can be seen in
the two scattergrams. In both situations when you
know the value of X then you know the value of Y. In the linear relationship
there is an additional requirement that if X is higher on the scale then Y must
also be higher on the scale. In Scattergram 2 that is
not always the true. Where it is seen that when X is 1 the
Y's are all 2's. The Y's are lower. Consequently, the linear
relationship does not hold in the second example. However, for conditional
relationship where the only requirement is that if you know the value of X then
predict that Y is a specific value then those
statistics that test such a condition remain perfect. The Pearson Correlation
represents the linear relationship and the Pearson Chi Square represents the
conditional relationship.
Notice that in the left scattergram all points are on the regression line
indicating a perfect relationship using the Pearson Correlation Coefficient. In
the right scattergram the Pearson will be less than
perfect because not all points are on the regression line. The next computer
run shows that those statistics that assume linear direction will be lowered
while those that do not will remain perfect relationships (conditional
probabilities).
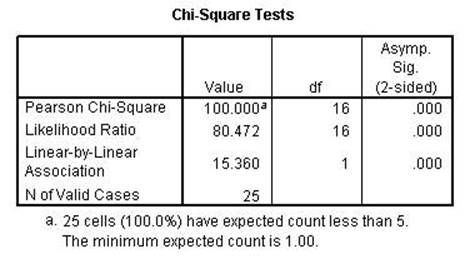
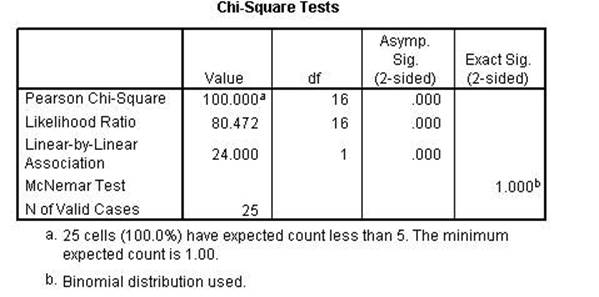
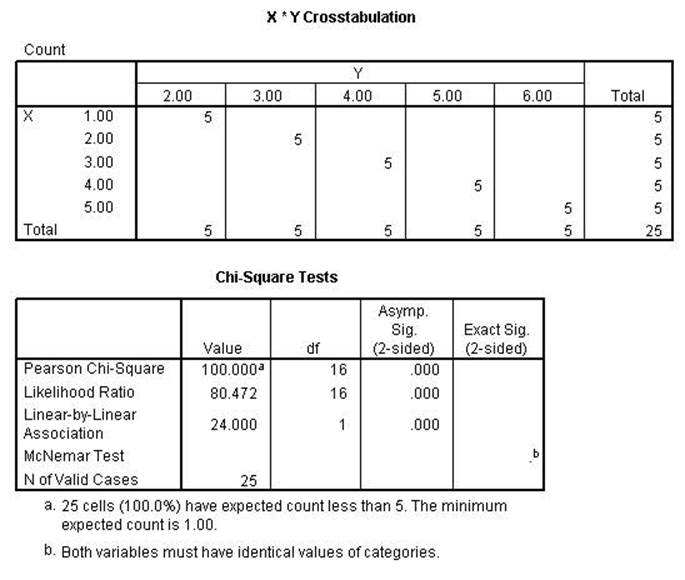
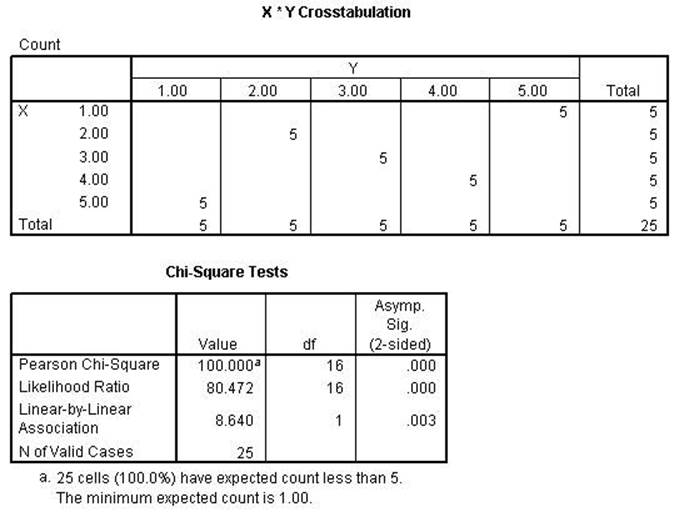
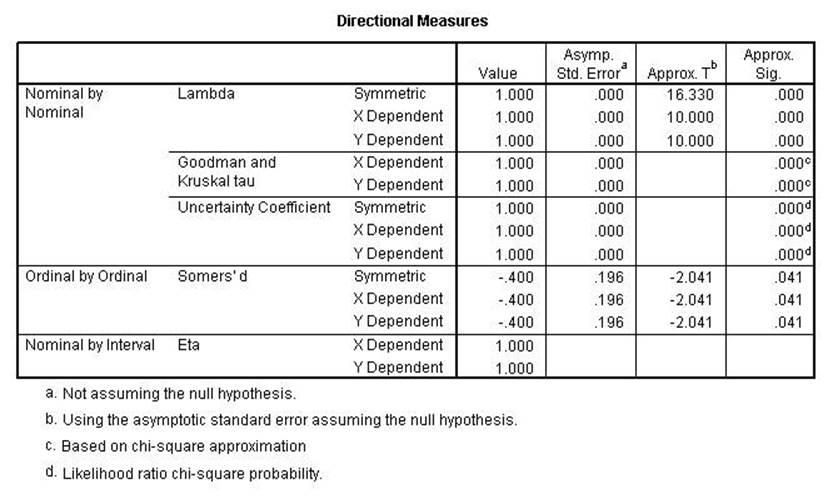
The Chi-square and the
Likelihood Ratio remained perfect while the Linear-by-Linear Association is
lower than the previous run. That indicates that the first two are conditional
while the 3rd is linear as the name implies.
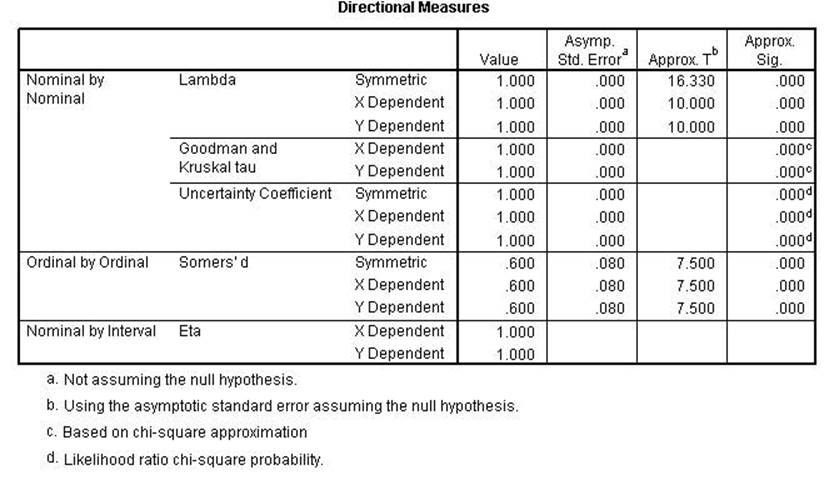
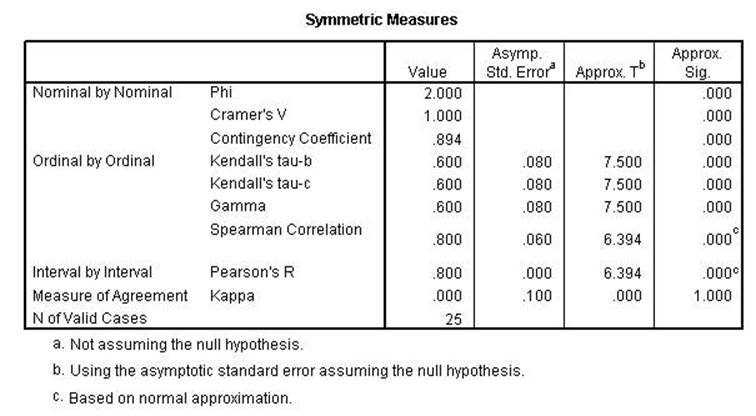
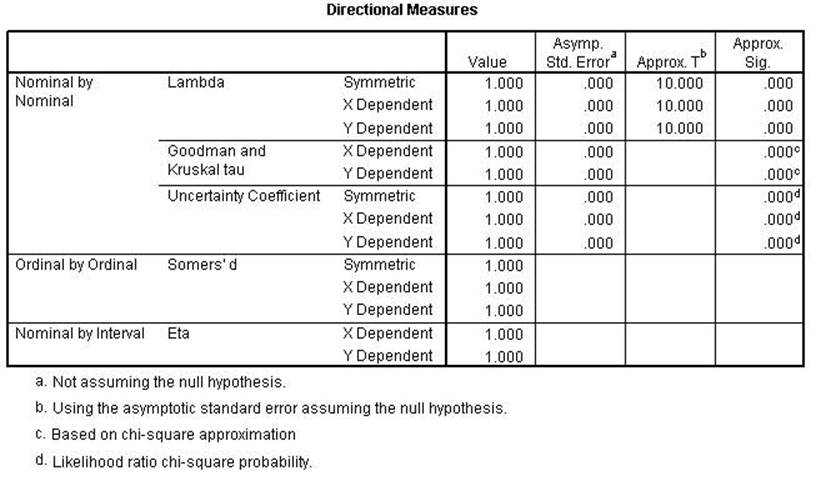
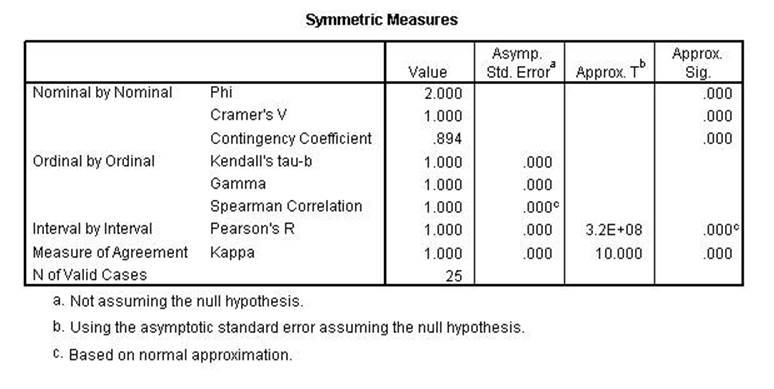
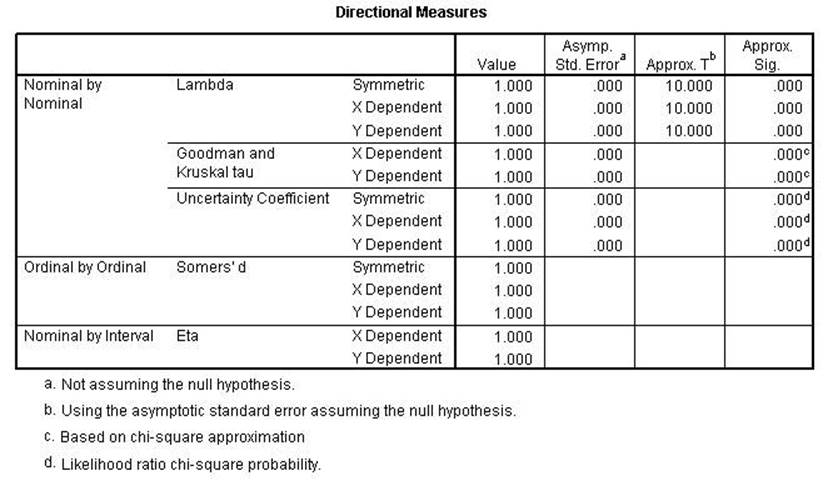
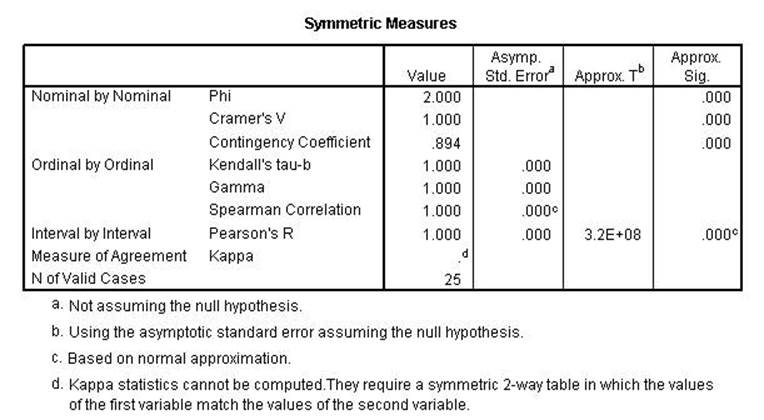
Chi Square, Lambda,
uncertainty coefficient, Phi, Cramer's V and the Contingency Coefficient all
remain the same indicating conditional relationships. Kendall's tau, Gamma,
Spearman Correlation, Pearson's r and Kappa were all lower indicating a linear relationshsip.