![]()
![]()
Chi Square Example
This next example is taken
from clients in a psychiatric setting and taking medications. The notion is
that specific medications should be associated with diagnosis. Consequently,
diagnosis is crosstabulated with medications taken.
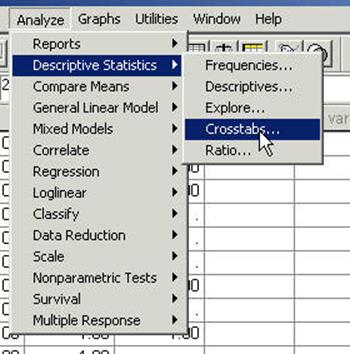
Run crosstabs in the
following manner to get the chi square.
Click Analyze
Select Descriptive Statistics.
Click Crosstabs.
That opens the following window
Select medicat (the rows variable)
Click the "right delta"
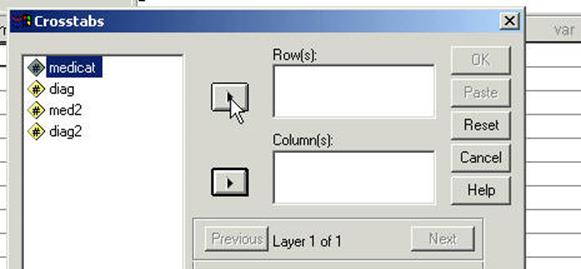
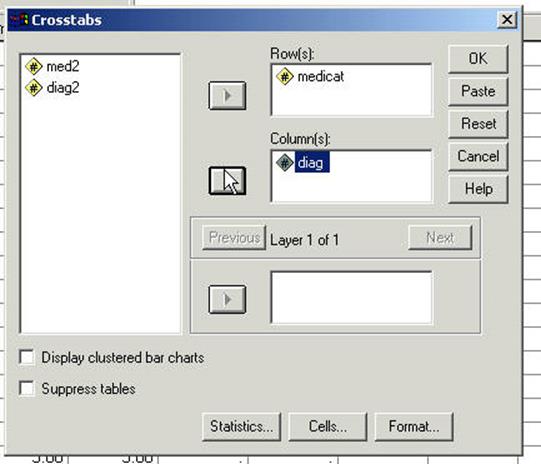
Select diag and
Click the "right delta"
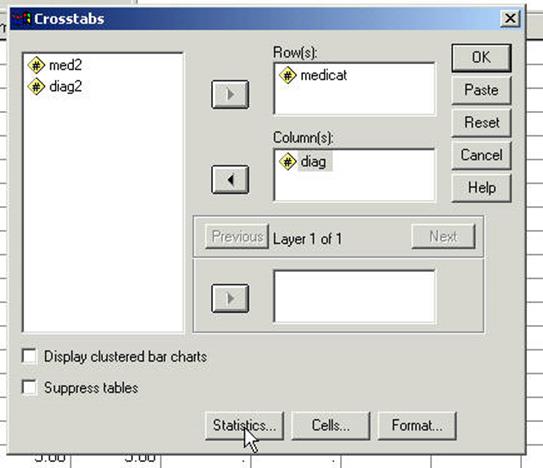
Click on Statistics
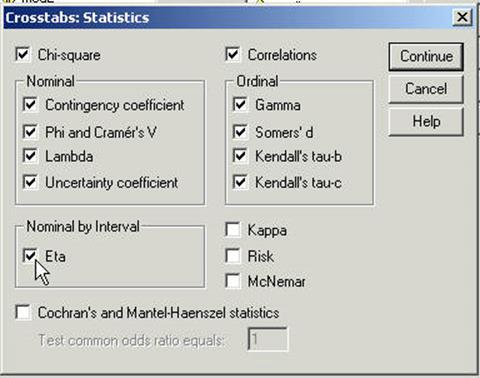
Select the options shown below
Click Continue
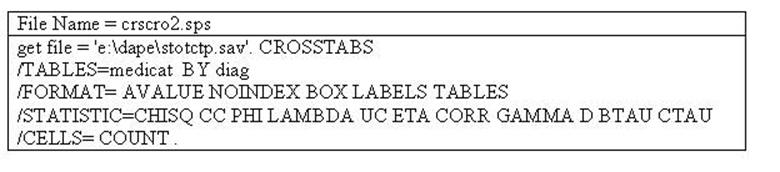
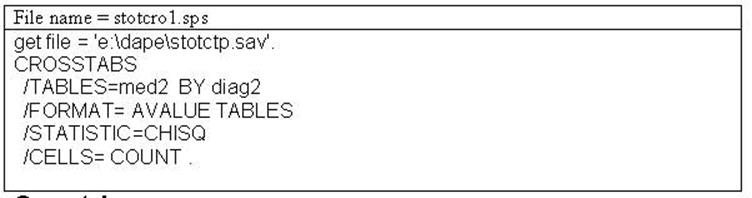
Click Paste and the following syntax file is generated. Run the program.
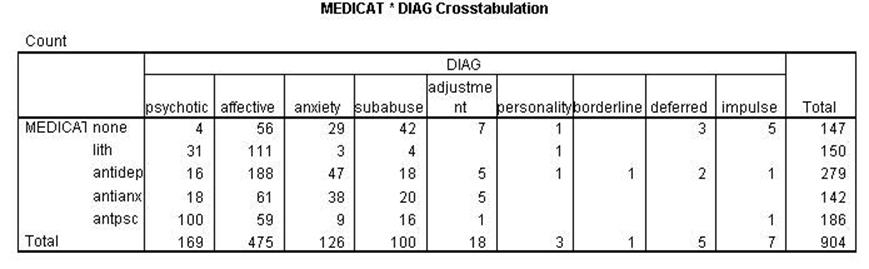
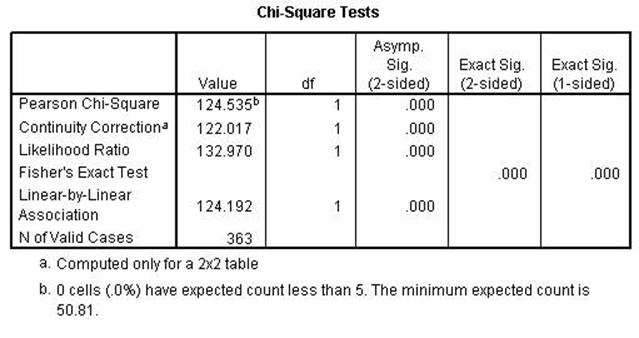
The following output is generated.
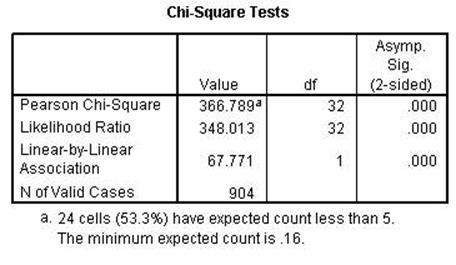
The problem with the
above data is that one does not know which of the cells are significantly
different. Consequently, it is not known whether the correct medications were
administered to the appropriate client. Chi square only indicates that some of
the cells are different from some other cells. The differences must be tested
pairwise. For example, the two diagnosis "affective" and
"psychotic" can be compared as to whether they are receiving "antidepressive" and "antipsychotic"
medications respectively. The following examples demonstrate.
The data must first be
recoded:
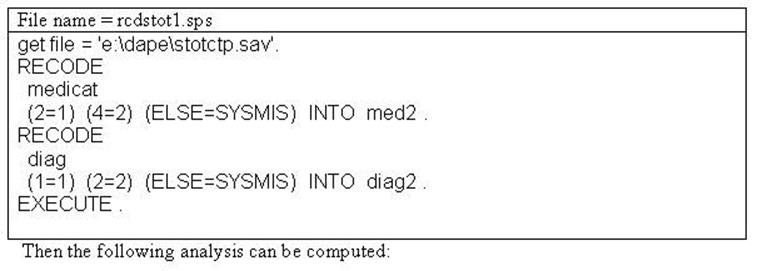
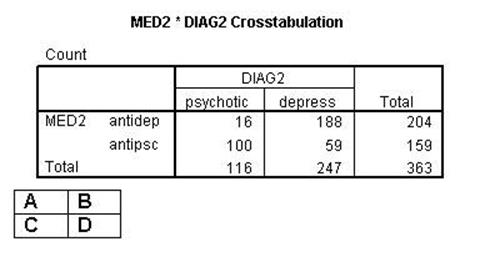
In the 2 X 2 contingency
table above one can test whether there is a differential administration of
medications to clients with different diagnoses. It was mentioned above that
when the contingency table was large one could not determine which of the cells
were significantly different from other specific cells. In the case of the 2X 2
one can make such a determination. The Chi Square will determine whether cells
A and D are different that cells B and C (see small table above for reference).
If cells A and D are different than cells B and C one concludes that
medications of antipsychotic and antianxiety were differentially administered
to clients with psychotic and affective disorders.